
The Diversity & Equity Campus Climate survey was created to help universities assess the quality and impact of their programs, as well as the strengths and weaknesses of their campus climates.
The survey was created by the Higher Education Data Sharing Consortium (HEDS), an independent organization of colleges and universities committed to sharing data, knowledge, and expertise to advance undergraduate education, inclusive excellence, and student success at member institutions.
In partnership with HEDS, Pitt administered the Diversity and Equity Campus Climate Survey in the winter of 2023 to all members of the University community.
The survey gauged perceptions of how each university supports diversity, inclusion, and equity; individual experiences with discrimination and harassment on each campus; and the community’s knowledge of resources related to reporting discrimination and harassment.
Summary
All University of Pittsburgh students, faculty, staff, and post-doctoral students on all campuses were invited to participate.
- Invited to participate: 47,106 people
- Total responses received: 6,468 people
- Response rate: 13.7 percent
In most respects, experiences at Pitt mirrored those of peer institutions. However, within certain key demographic groups at Pitt — including non-white and LGBTQIA+ members of the community — Pitt is lagging its peer institutions, and there are opportunities for improvement.
Race
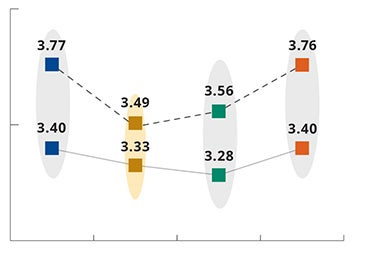
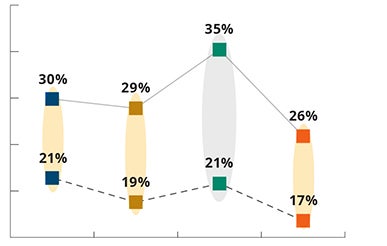
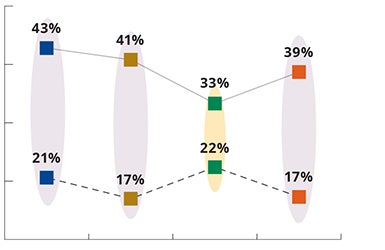
Underrepresented Minority (URM) members of the Pitt community, the largest share identifying as Black/African-American or Hispanic/Latinx, report significantly lower satisfaction with the campus climate than their white counterparts.
Campus Climate for Diversity and Equity Indicator by Respondent Race
 |
|
Experienced Discrimination/Harassment by Respondent Race
 |
|
Gender Identity
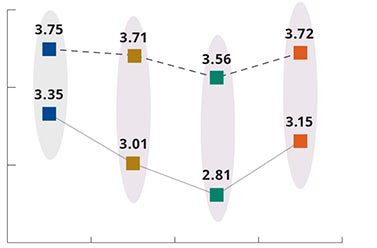
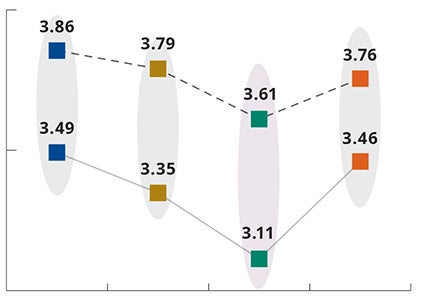
Cisgender (non-transgender) members of the Pitt community report significantly higher satisfaction with the campus climate than do their transgender, gender non-conforming, and non-binary counterparts. Regarding the perception of the campus climate around gender identity, there is little or no difference in experiences reported by cisgender men and cisgender women.
Campus Climate for Diversity and Equity Indicator by Respondent Gender Identity
 |
|
Experienced Discrimination/Harassment by Respondent Gender Identity
 |
|
Sexual Orientation
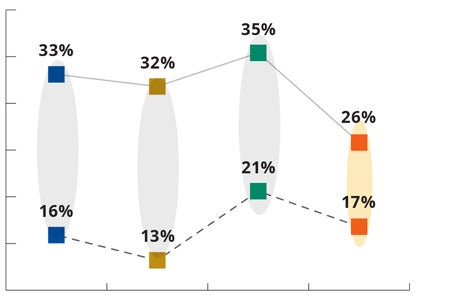
The same trend seen amongst members of Pitt’s trans/non-binary community can be seen amongst the wider LGBQ+ community. Across all constituencies, members of the LGBQ+ community have more negative perceptions of the campus climate than their straight and heterosexual counterparts.
Campus Climate for Diversity and Equity Indicator by Respondent Sexual Orientation
 |
|
Experienced Discrimination/Harassment by Respondent Sexual Orientation
 |
|
Leading Climate Indicators
- Campus Climate for Diversity and Equity Indicator
-
(Four satisfaction questions related to campus climate and belonging)
Please indicate your level of satisfaction with the following:
• Overall campus climate • The campus experience/environment regarding diversity • The extent to which you experience a sense of belonging or community • The extent to which you feel all community members experience a sense of belonging or community
Response Scale: Strongly Disagree (1) – Strongly Agree (5)
Gender Identity Undergraduates Graduate/Professional Faculty Staff/Administrators Post-Doctoral Students Unknown Role Cisgender Man 3.877 3.867 3.660 3.774 3.985 3.107 Cisgender Woman 3.672 3.613 3.479 3.701 3.793 3.145 Non-Binary/Transgender 3.332 3.011 2.808 3.154 3.125 Unknown Gender 3.303 3.638 3.240 3.466 3.346 Sexual Orientation Undergraduates Graduate/Professional Faculty Staff/Administrators Post-Doctoral Students Unknown Role Heterosexual 3.8549 3.7899 3.6108 3.7549 3.9300 3.3784 LGBQ+ 3.4915 3.3484 3.1128 3.4603 3.5690 2.9667 Unknown Orientation 3.5788 3.6353 3.3835 3.6475 3.7969 3.2525 Race/Ethnicity Undergraduates Graduate/Professional Faculty Staff/Administrators Post-Doctoral Students Unknown Role African-American/Black 3.212 3.177 3.114 3.301 Asian 3.855 3.940 3.766 3.953 4.417 Hispanic/Latino/Latinx 3.553 3.269 3.795 3.500 3.792 International 3.984 3.983 3.957 3.943 4.125 Multiple Races/Ethnicities 3.469 3.319 3.255 3.510 3.045 White 3.766 3.492 3.558 3.758 3.635 3.175 All Other Races/Ethnicities 2.850 3.900 3.375 3.476 Unknown Race 3.429 3.625 3.374 3.474 3.270 - Institutional Support for Diversity and Equity Indicator
-
(Four questions related to recruitment and retention and institutional support for diversity)
Please indicate your level of agreement with each of the following statements :
• The campus environment is free from tensions related to individual or group differences • Recruitment of historically marginalized students, faculty, and staff is an institutional priority • Retention of historically marginalized students, faculty, and staff is an institutional priority • Senior leadership demonstrates a commitment to diversity and equity on this campus
Response Scale: Strongly Disagree (1) – Strongly Agree (5)
Gender Identity Undergraduates Graduate/Professional Faculty Staff/Administrators Post-Doctoral Students Unknown Role Cisgender Man 3.691 3.777 3.515 3.594 3.824 3.232 Cisgender Woman 3.462 3.359 3.232 3.443 3.386 3.014 Non-Binary/Transgender 2.984 2.345 2.346 2.807 2.917 Unknown Gender 3.061 3.613 3.356 3.254 3.306 Sexual Orientation Undergraduates Graduate/Professional Faculty Staff/Administrators Post-Doctoral Students Unknown Role Heterosexual 3.670 3.640 3.419 3.532 3.631 3.392 LGBQ+ 3.204 2.970 2.776 3.152 3.405 2.617 Unknown Orientation 3.427 3.381 3.354 3.401 3.484 3.230 Race/Ethnicity Undergraduates Graduate/Professional Faculty Staff/Administrators Post-Doctoral Students Unknown Role African-American/Black 2.996 2.945 2.737 2.895 Asian 3.576 3.510 3.576 3.753 4.000 Hispanic/Latino/Latinx 3.488 2.833 3.591 3.210 3.667 International 3.922 3.872 3.802 3.661 3.829 Multiple Races/Ethnicities 3.310 3.042 3.166 3.172 2.938 White 3.516 3.204 3.343 3.534 3.446 3.395 All Other Races/Ethnicities 2.650 3.694 3.250 3.548 Unknown Race 3.285 3.546 3.386 3.331 3.181 - Experiences of Discrimination or Harassment
-
Have you ever been discriminated against or harassed on campus, at an off-campus residence, or at an off-campus program/event affiliated with the University of Pittsburgh?
(Percentage of respondents, out of 100, who answered “Yes”)
Race/Ethnicity Undergraduates Graduate/Professional Faculty Staff/Administrators Post-Doctoral Students Unknown Role African-American/Black 32.35 28.13 32.76 28.13 Asian 16.16 12.00 23.16 13.33 11.11 Hispanic/Latino/Latinx 35.00 40.00 22.73 8.00 50.00 International 17.50 11.90 6.25 14.58 12.94 Multiple Races/Ethnicities 29.00 27.06 36.96 24.03 33.33 White 21.42 18.83 20.78 16.80 15.69 42.11 All Other Races/Ethnicities 20.00 30.00 60.00 38.10 Unknown Race 41.46 35.90 30.68 22.41 33.33 Gender Identity Undergraduates Graduate/Professional Faculty Staff/Administrators Post-Doctoral Students Unknown Role Cisgender Man 14.74 13.54 15.31 12.65 14.29 42.86 Cisgender Woman 23.80 19.05 28.55 19.27 23.08 48.65 Non-Binary/Transgender 42.75 40.82 33.33 38.71 16.67 Unknown Gender 38.71 23.81 33.33 32.35 29.79 Sexual Orientation Undergraduates Graduate/Professional Faculty Staff/Administrators Post-Doctoral Students Unknown Role Heterosexual 15.91 13.16 20.64 16.76 16.41 50.00 LGBQ+ 33.12 31.82 35.37 25.79 28.57 42.86 Unknown Orientation 25.83 20.72 29.41 18.23 12.50 29.90 - I Often Wonder “Maybe I Don’t Belong Here“
-
Response Scale: Strongly Agree (1) – Strongly Disagree (5)
Race/Ethnicity Undergraduates Graduate/Professional Faculty Staff/Administrators Post-Doctoral Students Unknown Role African-American/Black 3.269 3.250 3.172 3.764 Asian 3.680 3.600 3.832 4.139 4.889 Hispanic/Latino/Latinx 3.350 3.267 4.000 3.840 International 3.859 3.815 3.851 3.979 3.847 Multiple Races/Ethnicities 3.452 3.271 3.363 3.611 3.273 White 3.684 3.611 3.747 3.999 3.840 3.316 All Other Races/Ethnicities 3.400 3.700 3.400 3.762 Unknown Race 3.368 3.222 3.349 3.613 3.356 Gender Identity Undergraduates Graduate/Professional Faculty Staff/Administrators Post-Doctoral Students Unknown Role Cisgender Man 3.843 3.839 3.844 4.003 4.119 2.846 Cisgender Woman 3.595 3.564 3.593 3.971 3.566 3.353 Non-Binary/Transgender 3.190 3.000 3.000 3.129 3.167 Unknown Gender 3.207 3.158 3.289 3.365 3.434 Sexual Orientation Undergraduates Graduate/Professional Faculty Staff/Administrators Post-Doctoral Students Unknown Role Heterosexual 3.766 3.766 3.769 4.028 3.856 3.206 LGBQ+ 3.427 3.263 3.193 3.592 3.655 2.933 Unknown Orientation 3.572 3.519 3.470 3.785 3.933 3.452 - Insensitive/Disparaging Remarks
-
During your time at Pitt, about how often have you heard someone make an insensitive or disparaging remark about:
• People who have a particular racial and/or ethnic identity • People of a particular sexual orientation • People of a particular gender or gender identity • People from a particular socioeconomic background • People from a particular religious background • People with a particular disability • People who are immigrants • People with a particular political affiliation/view • People of a particular age or generation • People for whom English is not their native language
Response Scale: Not Often (1) – Very Frequently (5)
Race/Ethnicity Undergraduates Graduate/Professional Faculty Staff/Administrators Post-Doctoral Students Unknown Role African-American/Black 2.800 3.229 2.528 2.806 Asian 2.689 2.789 2.690 3.092 3.575 Hispanic/Latino/Latinx 2.422 3.213 3.120 3.309 2.950 International 3.244 3.145 3.120 3.309 3.603 Multiple Races/Ethnicities 2.735 2.612 2.698 2.522 2.717 White 2.722 2.709 2.426 2.585 2.914 2.205 All Other Races/Ethnicities 2.690 4.171 2.930 2.200 Unknown Race 2.878 3.162 2.681 2.781 2.784 Gender Identity Undergraduates Graduate/Professional Faculty Staff/Administrators Post-Doctoral Students Unknown Role Cisgender Man 2.878 3.171 2.467 2.640 3.475 2.085 Cisgender Woman 2.699 2.771 2.534 2.618 2.935 2.676 Non-Binary/Transgender 2.689 2.906 2.774 2.502 3.250 Unknown Gender 2.880 2.978 2.411 3.003 2.782 Sexual Orientation Undergraduates Graduate/Professional Faculty Staff/Administrators Post-Doctoral Students Unknown Role Heterosexual 2.768 2.944 2.484 2.626 3.192 2.369 LGBQ+ 2.727 2.810 2.473 2.561 3.082 2.591 Unknown Orientation 2.809 3.021 2.747 2.822 3.793 2.857
Explore All Data
Drop-down filters are available on each dashboard that allow users to view data for a specific subgroup of interest. To filter the data, select the down arrow to see the available filter options and select the subgroup of interest. Select “Revert” at the bottom of the screen to remove the current filters and to go back to the full data set. Users can “hover” their mouse over visualizations to see additional context and values that are not shown. Note that tables with values are available for each visualization. Additional visualizations/tables are available by clicking the labeled tabs at the top of the dashboard.
To protect the privacy of individuals, we have suppressed subgroups smaller than 5.
In the interest of transparency and completeness, Pitt is posting race data for faculty two ways: first, as required by the federal government (IPEDS), and second, to include all faculty who identify with a particular race of interest, regardless of other race/ethnicity categories with which they identify.